* Bump version of go-redis to 9.6.0 * Trigger CI on branch v9.6 |
||
|---|---|---|
| .. | ||
| config | ||
| image | ||
| README.md | ||
| client.go | ||
| docker-compose.yml | ||
| go.mod | ||
| go.sum | ||
| uptrace.yml | ||
README.md
Example for go-redis OpenTelemetry instrumentation
This example demonstrates how to monitor Redis using OpenTelemetry and Uptrace. It requires Docker to start Redis Server and Uptrace.
See Monitoring Go Redis Performance and Errors for details.
Step 1. Download the example using Git:
git clone https://github.com/redis/go-redis.git
cd example/otel
Step 2. Start the services using Docker:
docker-compose up -d
Step 3. Make sure Uptrace is running:
docker-compose logs uptrace
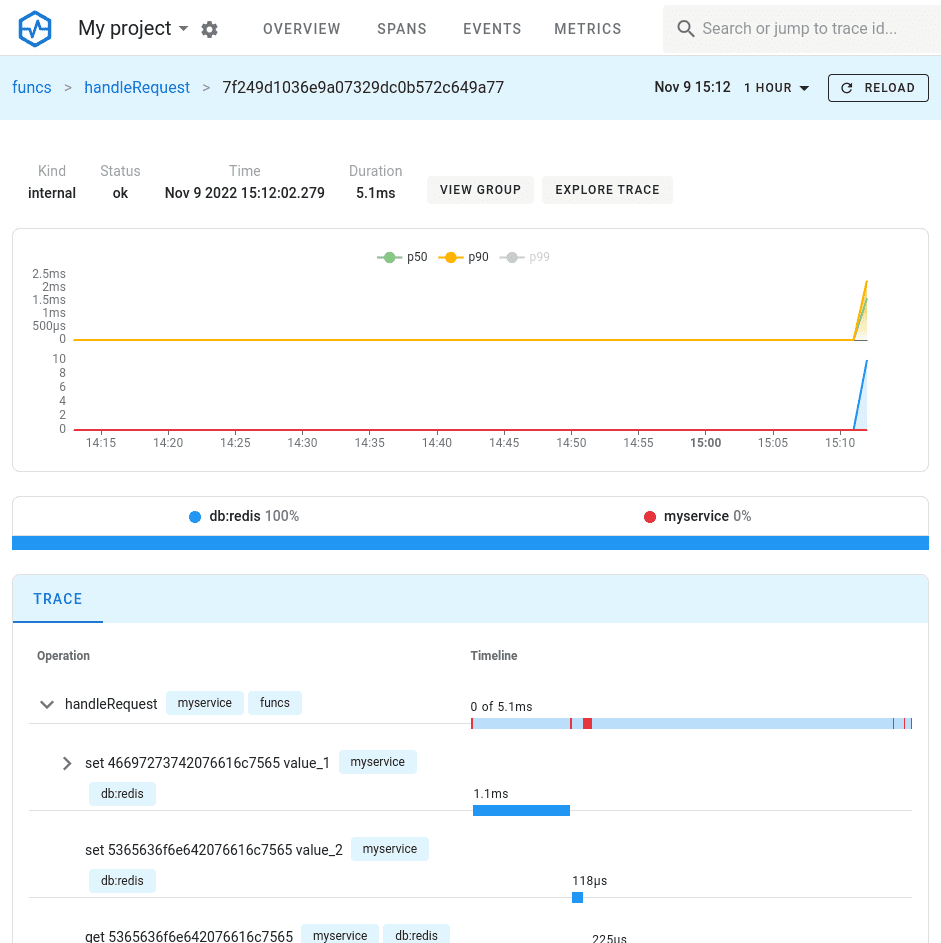
Step 4. Run the Redis client example and Follow the link to view the trace:
go run client.go
trace: http://localhost:14318/traces/ee029d8782242c8ed38b16d961093b35
You can also open Uptrace UI at http://localhost:14318 to view available spans, logs, and metrics.
Redis monitoring
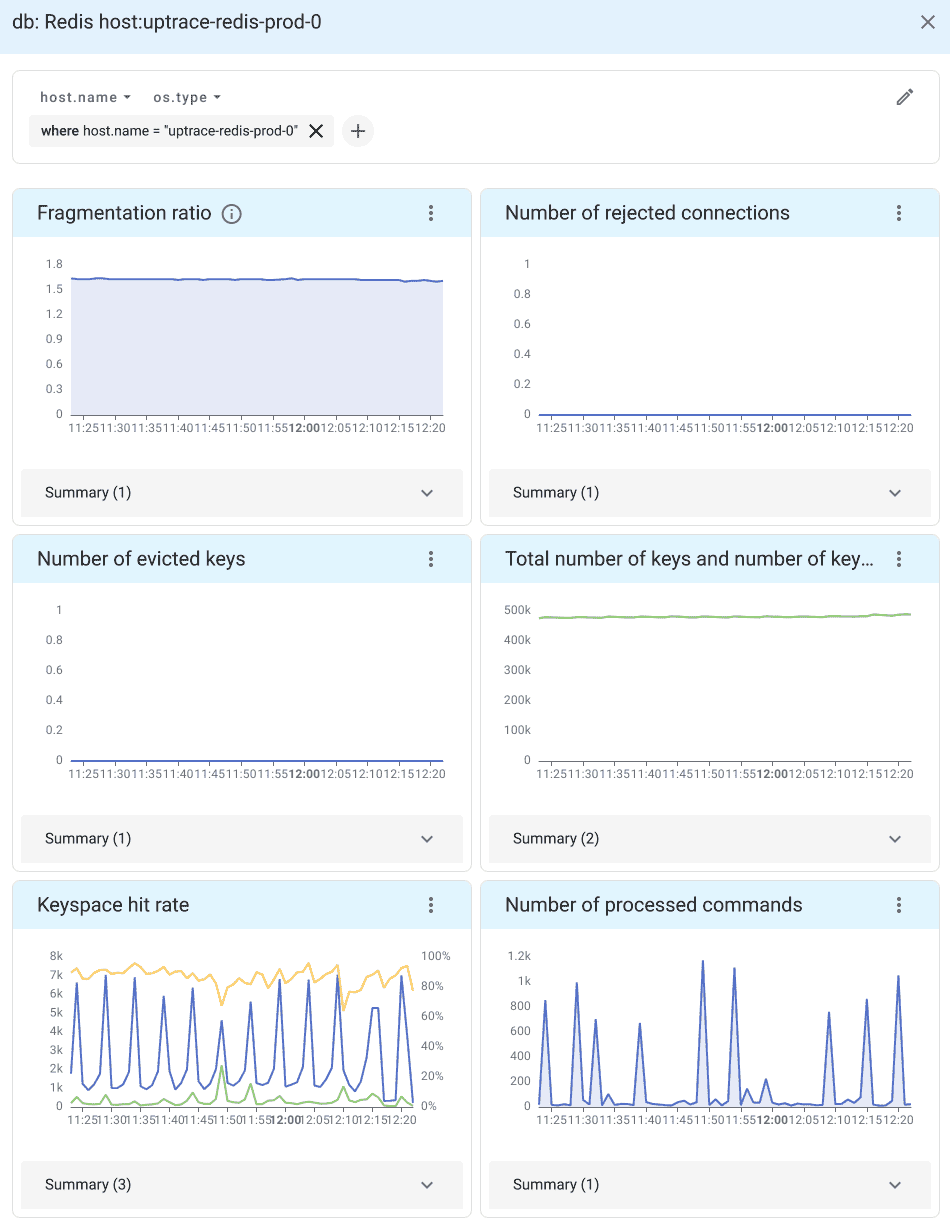
You can also monitor Redis performance metrics By installing OpenTelemetry Collector.
OpenTelemetry Collector is an agent that pulls telemetry data from systems you want to monitor and sends it to APM tools using the OpenTelemetry protocol (OTLP).
When telemetry data reaches Uptrace, it automatically generates a Redis dashboard from a pre-defined template.

